Self recognition in apes and dogs
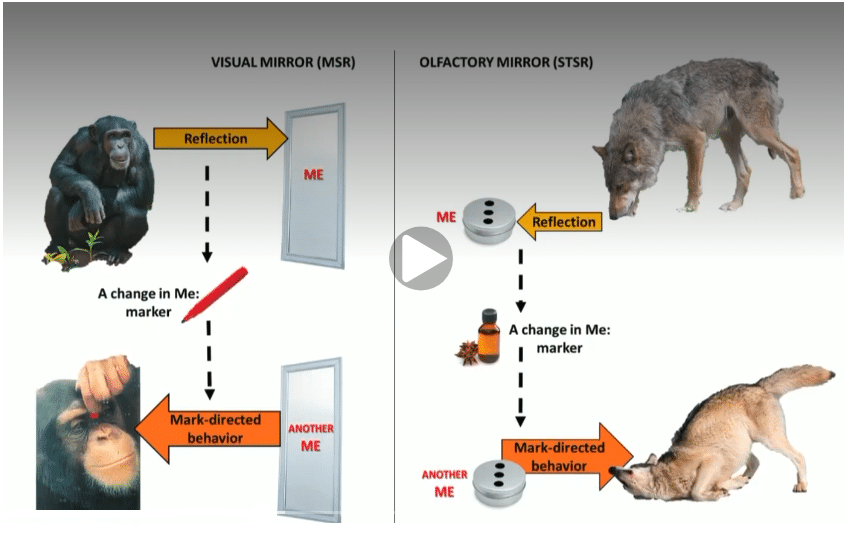
The famous self-recognition test developed by psychologist Gordon Gallup Jr. tests the ability of an animal to recognize itself. The standard protocol involves a red spot on the forehead of the animal and a mirror for the animal to look up. This implementation is appropriate for animals with a strong visual sense, e.g. humans or non-human primates. A generalized self-recognition protocol should respects the cognitive specificity of each species, such as primates (visual dominance) or canids (olfactory dominance).
Image screen-captured from the video
Scientific Speciesism: The Myth of Human Exceptionalism (2026)
with Christine Webb
Documentary “Dans la tête des Globicéphales”

Photo Mmo iwdg, CC BY-SA 3.0, via Wikimedia Commons
The teaser video of a documentary describing the research conducted by ILCB team Cetaceans: Non-Human Conversations is shared online by its authors Rémi Demarthon and Argonautes Collective: Dans la tête des globicéphales.
Don’t miss it!
Avatar représentation, interaction et communication
Olivia Petit, Laurent Perrinet, Charlotte Roy (INT)
Neurophysiological Mechanisms of Optimized Graphomotor Performance in Biscriptuals
Yitong Zuo, Gaëlle Alhaddad, Víctor J. López-Madrona, et al.
2026. Imaging Neuroscience 4 (June): IMAG.a.1265. — @HAL
Common Evidence, Multiple Interpretations: Commentaries on a Multilab Study on Musicians’ Short-Term Memory
Rafael Román-Caballero, Deniz Başkent, Anne Caclin, et al.
2026. Advances in Methods and Practices in Psychological Science 9 (2). — @HAL
The Lifetime of Sequential Memory Traces
Leonardo Pinto Arata, Carlos Ramisch, and Arnaud Rey.
2026. Memory & Cognition. — @HAL
Perceptual Assessment of Phonetic Convergence between Speakers: A Bayesian Meta-Analysis
Leonardo Lancia, Noël Nguyen, and Jennifer S. Pardo.
2026 Journal of Phonetics 117 (July): 101510. — @HAL
Back on Track: Remediating Developmental Dyslexia with a Home-Based Multi-Component Program
Karine Louna Harrar-Eskinazi, Ambre Denis-Noël, Bruno De Cara, et al.
2026. Annals of Dyslexia. — @HAL
Longitudinal MRI Template of the Baboon Brain from Birth to Adolescence
Katherine L. Bryant, Arnaud Le Troter, David Meunier, et al.
2026. Imaging Neuroscience. — @HAL
Liliane Sprenger-Charolles (1946-2026)

The Institute of Language, Communication and the Brain (ILCB) is deeply saddened by the passing of Liliane Sprenger-Charolles, a colleague, friend, and one of the leading figures in international research on reading acquisition and literacy development. Liliane was emeritus CNRS researcher at the Centre for Research in Psychology and Neuroscience CRPN.
Throughout her distinguished career, Liliane built an exceptional body of work at the crossroads of linguistics, cognitive psychology, education, and speech-language pathology. Her research fundamentally advanced our understanding of how children learn to read, why some encounter difficulties, and how scientific evidence can inform educational practice and reduce inequalities.
A pioneer in cross-linguistic and cross-orthographic research, Liliane played a key role in demonstrating how the characteristics of writing systems shape reading acquisition and developmental dyslexia. Her work on decoding, reading comprehension, spelling, and reading disorders has become foundational in the field and has influenced generations of researchers, educators, and clinicians worldwide.
Beyond her scientific contributions, Liliane was a passionate advocate for evidence-based education and literacy development. Her expertise was sought by numerous national and international organisations, including initiatives aimed at improving literacy outcomes in developing countries. She possessed a rare ability to connect theoretical models, developmental research, clinical studies, and educational applications, helping bridge the gap between science and practice.
Those who had the privilege of working with her will remember not only her intellectual rigor and scientific excellence, but also her generosity, integrity, and unwavering commitment to mentoring younger researchers. She combined high standards with kindness, curiosity, and a deep sense of responsibility toward both science and society.
Liliane’s scientific and human legacy will continue to inspire our community for many years to come. She will be greatly missed.